Make A Line Plot to Display a Data Set
 Measurement & Data – 4th Grade
Represent and interpret data.
CCSS.Math.Content.4.MD.B.4
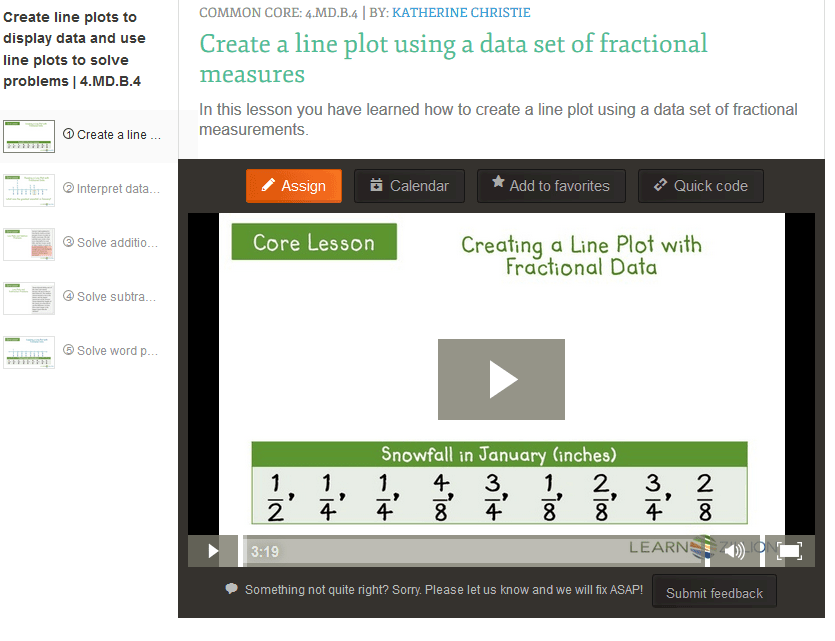
Make a line plot to display a data set of measurements in fractions of a unit (1/2, 1/4, 1/8). Solve problems involving addition and subtraction of fractions by using information presented in line plots. For example, from a line plot find and interpret the difference in length between the longest and shortest specimens in an insect collection.
Make a line plot to display a data set of measurements in fractions of a unit (1/2, 1/4, 1/8). Solve problems involving addition and subtraction of fractions by using information presented in line plots. For example, from a line plot find and interpret the difference in length between the longest and shortest specimens in an insect collection.
Teacher Notes
Line plots are a way to display a set of data so we can organize and interpret the data. Fractions are used to express measurements that fall between whole numbers.
Student Knowledge Goals
I can add fractions using information presented in line plots.
I can subtract fractions using information presented in line plots.
I can subtract fractions using information presented in line plots.
I can measure objects to 1/8 of a unit.
I know how to make a line plot.
I can represent a data set on a line plot.
I can add and subtract fractions based on the information represented on the line plot.
I can represent a data set on a line plot.
I can add and subtract fractions based on the information represented on the line plot.
Vocabulary
data
fraction (1/2, 1/4, 1/8)
line plot
fraction (1/2, 1/4, 1/8)
line plot
Lessons
Engage NY Module 5 E-28 – Solve word problems with line plots.
Line Plots
Student Video Lessons
Study Jams – Line Plots
Online Problems and Assessments
Khan Academy – Questions and Video Lessons
Interpret line plots
Create line plots
Online Games
Line Plots
Printables
Line Plots
Assessment Task 1
Assessment Task 2
Assessment Task 3
Assessment Task 4
Assessment Task 5